In my last blog entry, I introduced Sara Storm’s “video analysis spreadsheet” and gave an overview of how it’s used. In this entry, I want to go more into depth. Here are some advanced tips, tricks, and hacks from the creator & long term users!
If you’ve never heard of this spreadsheet, you may want to pop back and read the first blog, here. This is a complex spreadsheet that takes your sales data & generates charts, graphs, and statistics. You can use this wealth of data to make decisions on what type of content to create, which platforms to lean into, and more.
I wanted to create this more in-depth blog entry about how actual performers are using this sales spreadsheet to get you started off on the right foot if you decide to use it!
Some Tips From The Creator, Sara
I spoke with Sara Storm about some pressing questions I had about best practices when using the spreadsheet. 1. If you are just starting in the middle of the year, do you have to go back to the first month of the year in order to get accurate data? Storm said:
There’s no harm at all to skipping previous months! When you look at the “Sales by Day of Week” tab, it does aggregate sales averages by month, but the calculations will ignore any months that don’t have sales entered.
If you leave the previous months fully blank, you will miss out on having accurate “Year to Date” totals. If you already know how much was earned in a month, you can simply put it in as one line item (or a few, if you want to separate by site) in that month’s tab, and then that’ll be included for YTD calculations! Going through to put in how much you earned on each site in previous months is actually a GREAT way to get started using the sheet mid-year, since you’ll immediately see some graphs and calculations happening, without having to do the individual sales.
2. How do you choose categories for your content? Do you choose them based off of what is popular on the platforms you are on? Or for which niches you are most successful in? Storm said:
I choose my categories based on what I have seen sell for me in the past, what I *want* to be creating, and what I know I already have a lot of clips in. If I’m trying to break into a new niche, I’ll absolutely add that as a category so I can watch how it is going! I have some big categories that still get a lot of sales, but I don’t film new content in them anymore. I still track them since it’s a nice comparison point to what I am actively creating.
At the end of every year I evaluate which categories I’m tracking, and will consider if I want to add or remove any. Usually, I end up just adding, because I don’t like to say goodbye to those data points!
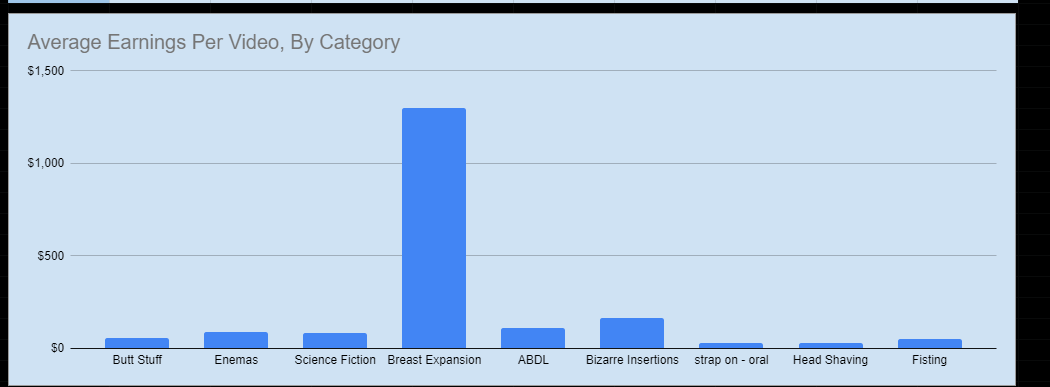
Graph shows average earnings per video, by category
Using Earning Statistics To Decide What to Film Next
I asked performer strangecares how they actually use the spreadsheet to improve their sales. One example they cited was the area where you see “average earnings per video, by category.”
“If I have a category that’s high-performing by that metric, but it’s a category I don’t actually have very many videos in, it’s often a hint about growth potential / underserved markets in my porn.”
In other words, you can look at how much money you make per category and look at the best performing categories. Then, you can decide which one you have too-few videos in and create a few more clips within that genre to maximize your profits. That seems like a pretty good way to get more money out of your clip creation.
Data Entry Workflow!
I asked Lacey Royce about her workflow for entering all of her sales (as a high volume content creator, I knew it would be a formidable amount of data entry and she was sure to have a great system.)
She shared with me that she usually did her work on a dual monitor, with the spreadsheet on one side and all her sites’ sales pages open on the other. But, recently while traveling she came up with a clever way to enter her data on her single-monitor laptop screen.
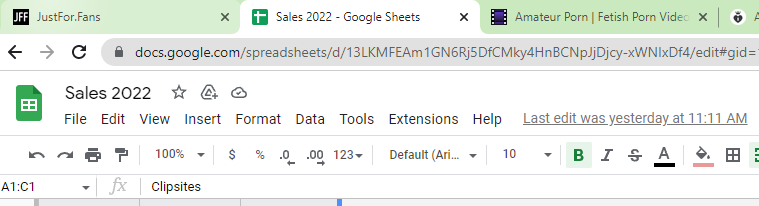
“I open the spreadsheet at the start and then all my tabs. I repeat the same process, but as I move through the tabs I move the spreadsheet tab to the right of the site I’m working on. When I’ve entered that day’s sales for that site, I move the tab to the right again and work on the next site. When the spreadsheet is at the end of the list of tabs, then that day’s entries are complete.”
Example of how multiple browser tabs can allow you to track your work flow!
Royce and Storm told me they enter their sales data daily. I do believe that if you’re a smaller volume content creator, once a week or even once a month would work fine for you.
Your Turn To Explore
Hopefully, with tips and tricks from these accomplished creators, you will find it easier to get started on the right foot with your data tracking.
Whether you choose to purchase Sara Storm’s Video Sales Analysis spreadsheet for use for your business or create your own data tracking graphs, data can do nothing but empower you. By analyzing sales data, you can make more informed decisions for your business.