Sara Storm’s Video Sales Analysis Spreadsheet
I used Sara Storm’s video sales analysis spreadsheet for the first quarter of 2022. Here’s what I learned.
Sara Storm, aka purplehailstorm, is a successful content creator who uses data analysis of sales to strategize marketing tactics. She has made some of her back end data analysis process available for other performers.
The spreadsheet and supporting documents are available on a sliding scale from GumRoad. It starts at $9.99 as a suggested price. With this bundle, you’ll get the spreadsheet, a set up guide, and a bonus cash flow tracker and video processing spreadsheet.
When you first download the sheet, the set up guide will teach you how to start entering your data. The basics are all laid out with step by step screencaps. Customizing your sheet can get a bit complicated, so if you are new to using Google sheets (or Excel) you may want to keep Google/YouTube handy to look up tutorials.
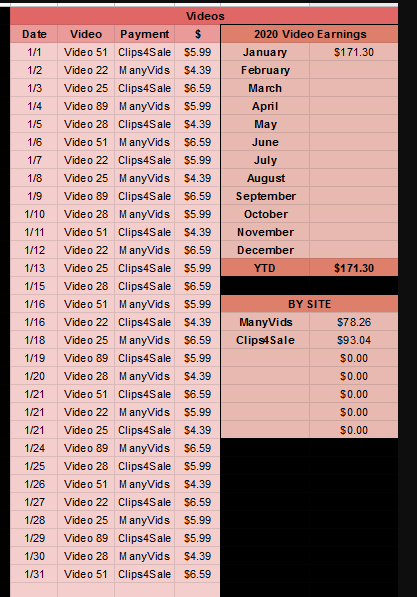
You’ll enter in a list of the clip sites or platforms for your income. Then you’ll go to the “Video Sales Analysis” tab, and fill in your videos by title. Luckily, I already had a spreadsheet with a list of my video titles & an index system for them, so I was able to quickly fill in that data and customize the sheet for my own naming/indexing conventions.
There’s also a column where you can fill out “pre-2022” earnings, if you happen to have that data already.
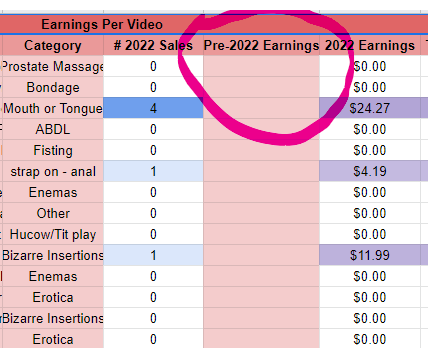
The “categories” are also totally custom. I recommend making a list of your main categories. You could even try using conditional formatting to make sure you don’t deviate from that list without realizing it.
Your next steps are to start entering your sales data. You’ll enter this data twice: Once on the sheet for the month you are currently in, and then on the video sales analysis sheet.
Here are some of the interesting data points this spreadsheet will generate for you:
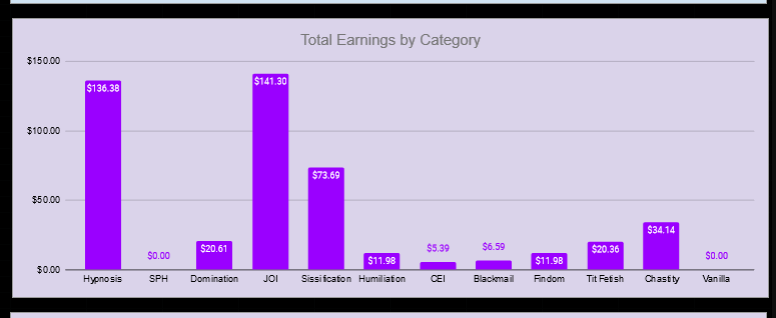
- Which video categories are making you the most money
- Which services you offer earn you the most
- Which platforms are performing the best
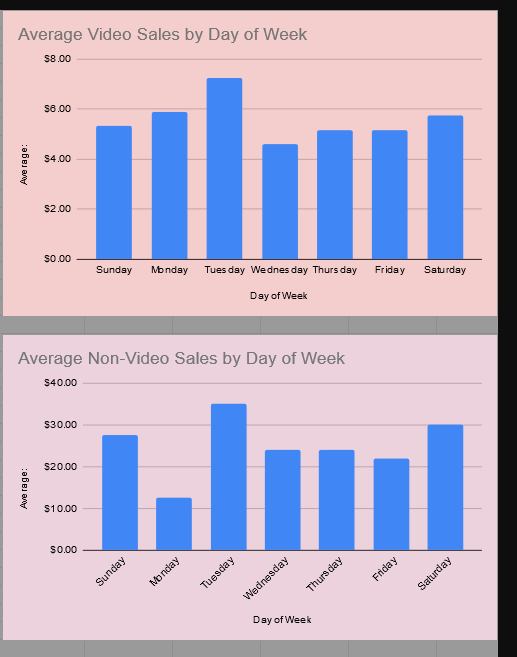
- Which day of the week tends to be the most profitable, by month and year
- Which videos have sold the most times, and earned the most money
- Which categories you have the most videos in
Here are some of the ways you could potentially use this data to improve your sales:
- Creating more content in categories that are doing well for you financially
- Learning your top sellers so you can promote them more effectively
- Uploading your content on the days that do best for you
- Prioritizing upload in on the platforms & categories you do best in
Ready to try this sheet yourself? You can download Sara Storm’s spreadsheet & related goodies here. If you end up using this sheet, I’d love to hear more about how it works for you!


